
I've got good news and bad news.
Good news: investing as a Limited Partner (LP) in commercial real estate doesn’t require a finance degree—just a solid grasp on the fundamentals (and 5th grade math).
Bad news: you still need to thoroughly vet the sponsor (a topic for another day).
But here's the upside: after reading this post, you'll have a better understanding of key proforma assumptions and, most importantly, be equipped to ask the sponsor (GP) better questions.
Here are five critical factors every LP should evaluate:
✅ Revenue Growth Assumptions
✅ Expense Growth and Ratios
✅ NOI Growth
✅ Debt Structure
✅ Cap Rates* (I left the most impactful for last, you'll see why)
Please note, this information is for educational purposes only and should not be considered as financial advice.
1️⃣ Revenue Growth Assumptions 📈
The most significant driver of returns in a CRE investment is revenue growth, which can be derived from rent increases or expense reduction (or both).
- Post-renovation rent growth should align with historical market averages (typically 1.5%–3%). Anything above 3% warrants further questioning.
- Comparative market analysis: Verify rent comps in the submarket; a two-mile difference in location can significantly impact rental demand and pricing.
- Occupancy and lease assumptions: If projected occupancy rates exceed 95%, question the rationale—historical U.S. averages hover around 9% vacancy.
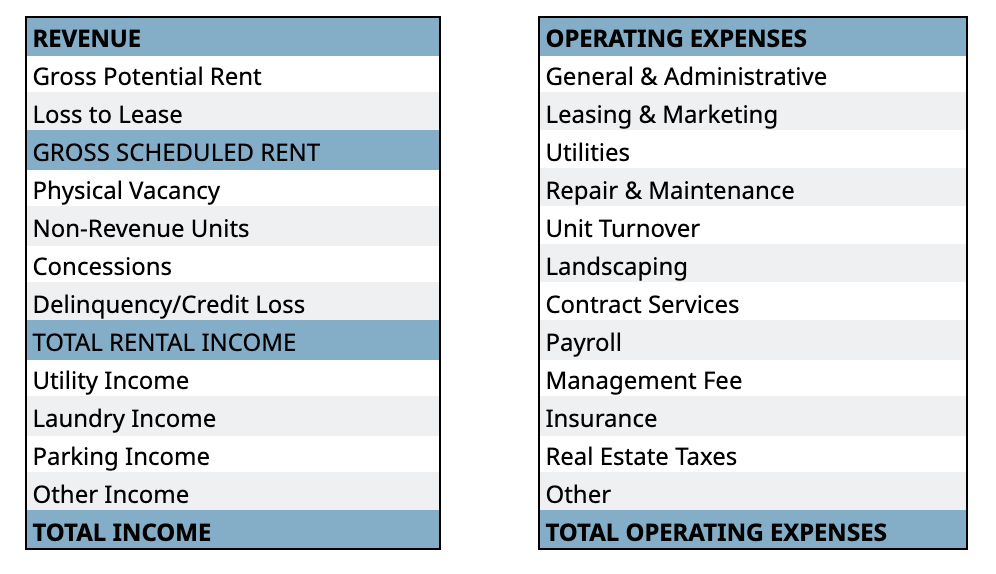
The table below shows what a detailed proforma will include. It's not atypical to see some of the categories combined. Ideally, you want to see how these numbers compare to T-12 (trailing 12 months of data from the seller).
2️⃣ Expense Growth and Ratios 💸
A sponsor’s ability to manage expenses effectively can make or break a deal. When reviewing the expense side of a proforma:
- Compare expense growth projections to historical trends. If expenses are growing slower than rents (e.g., <2.5% per year), this may be unrealistic. If a deal projects a sharp drop in expenses under new ownership, ask about what’s driving the change.
- Evaluate the expense ratio (total expenses / total revenue):
- Class A properties: Anything below 33% is questionable.
- Class C properties: Anything below 37% is questionable.
- Properties in high-tax, high-insurance states (e.g., TX, FL, LA) tend to have higher expense ratios.
- Pay attention to insurance and tax projections, as these costs have surged in recent years and could materially impact NOI.
- This National Risk Index Map from FEMA is an excellent (and free) resource.
3️⃣ Net Operating Income (NOI) Growth 📈🏢💰
NOI is a critical metric that influences the asset’s valuation and cash flow stability.
- In value-add deals, it's common to see NOI jump 7%-10% in the first couple of years. However, once improvements are complete, growth should taper off to more sustainable levels, typically in line with inflation (2%-3%).
- CAGR (Compound Annual Growth Rate) analysis: Calculate the projected NOI growth to ensure it aligns with historical trends. Here's a CAGR Calculator
- Revenue vs. expense-driven NOI growth: Sponsors often focus on revenue growth, but controlling expenses is equally important.
4️⃣ Debt Structure and DSCR 🏦
The financing structure impacts risk exposure: as the late great Charlie Munger said, "Smart men go broke three ways: liquor, ladies and leverage." I can't help with the former two, but the latter can be screened for.
- Interest-only (I/O) periods: When does the loan transition to amortization? What impact does it have on free cash flow to investors?
- Debt service coverage ratio (DSCR) analysis:
- A DSCR of 1.25x or higher is typically required by lenders. (Higher ratio indicates more cash flow available to cover debt payments).
- Ensure DSCR calculations account for amortization, not just I/O periods/
- Break-even occupancy: Understand the minimum occupancy needed to cover debt service—lower is better for risk mitigation.
- Prepayment penalties and yield maintenance: Be sure to review these terms carefully— they can significantly affect the deal's IRR.
- Fixed vs. floating interest rates: If floating, is the sponsor purchasing a rate cap? What duration? (Ideally, rate cap duration will match the loan term, i.e. 3 year loan will come with a 3 year rate cap).
5️⃣ Cap Rates and Exit Assumptions 💰
If you remember only one thing from this post, I want you to remember this: exit capitalization (cap) rate assumption has the most impact on overall return projections. This is the easiest metric to manipulate, and it happens to be ENTIRELY outside the sponsor's control.
📌 Cap Rate Definition: The capitalization rate (cap rate) is calculated as NOI ÷ Property Value and represents the expected return on a property.
- Entry Cap Rate: Compare the sponsor’s entry cap rate to historical trends for the asset type and location. For deep value-add deals, entry cap rates can be very low (as low as 0% for vacant buildings that don't generate any cash flow).
- Exit Cap Rate Assumptions: Exit cap rates significantly impact projected returns. Always ask for a cap rate sensitivity analysis stressing exit cap rates at least 200 basis points (2%) above the underwritten assumption.
- Some GPs project cap rate expansion on a yearly basis (e.g., 15 basis points per year, totaling 75 basis points over a 5-year hold), while others apply a fixed exit cap rate assumption.
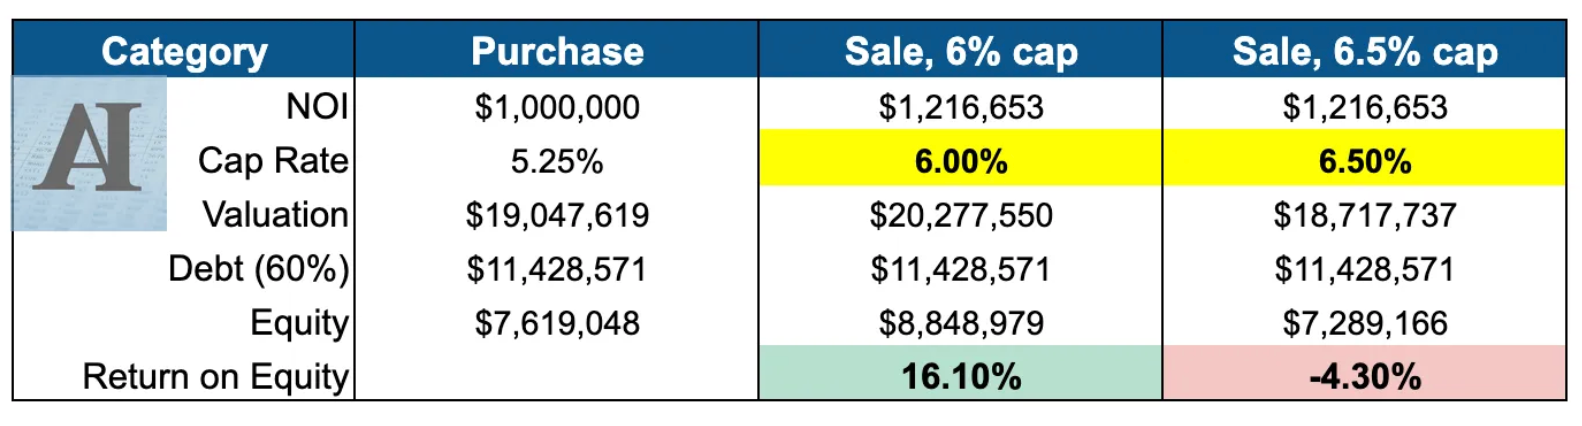
Here's an example: A property with a $1M NOI is purchased at a 5.25% cap rate. For simplicity, we'll ignore cash flow and assume fixed debt with no prepayment penalties. With NOI growing at 4% annually, see how a mere 50 basis point shift in the exit cap rate (from 6% to 6.5%) impacts equity!
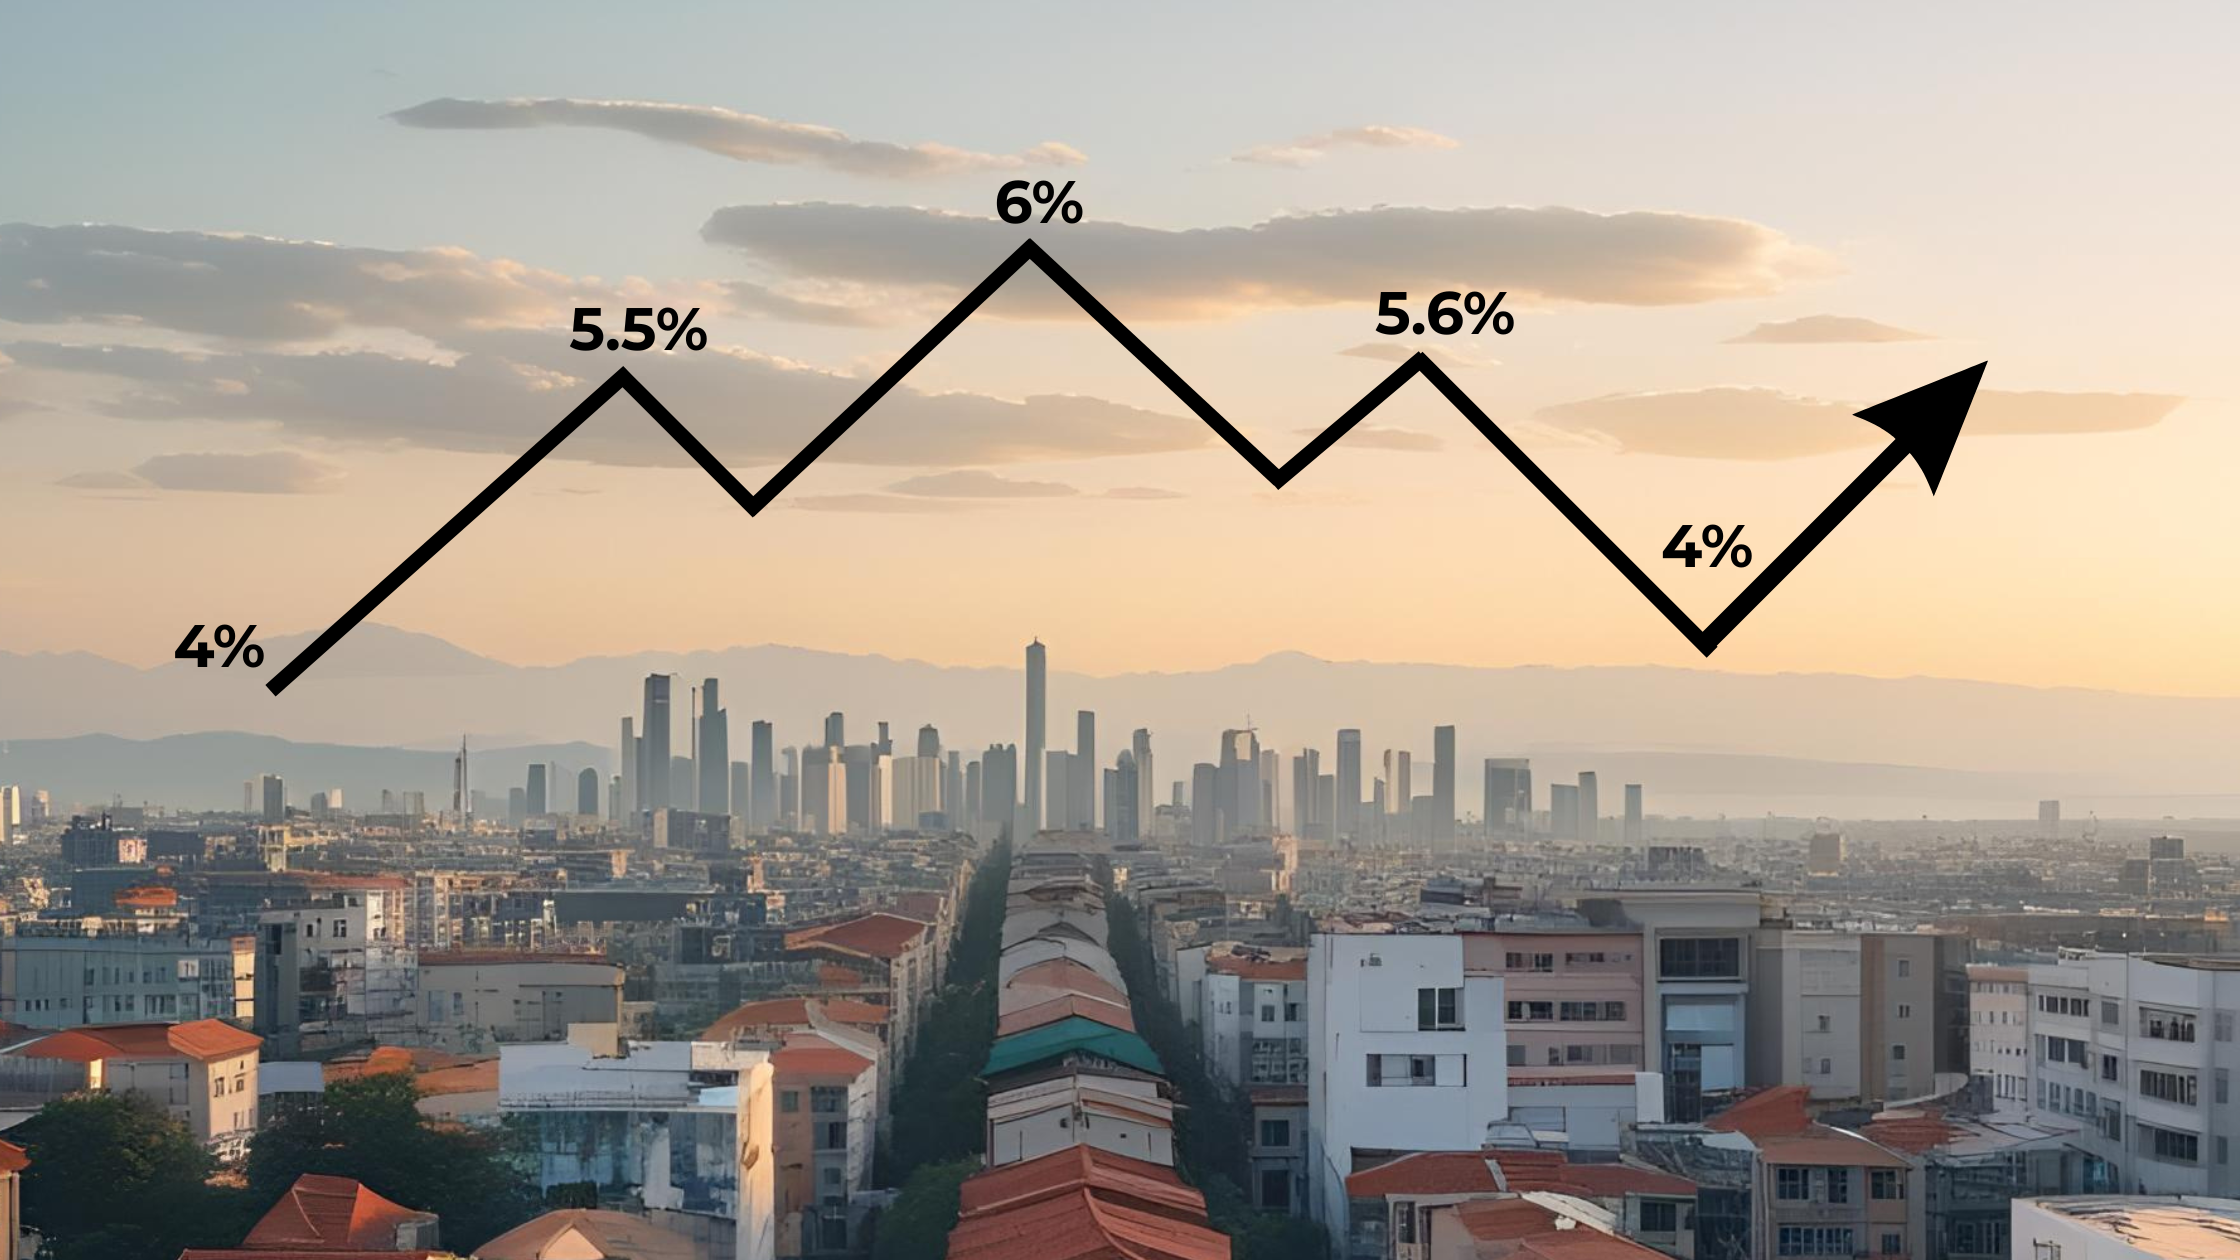
- Market Trends: Cap rates are influenced by macroeconomic conditions, including interest rates and supply-demand dynamics. Recent trends show cap rate expansion due to rising borrowing costs—investors should account for potential future shifts.
- Risk Considerations: Deep value-add properties often trade at lower cap rates due to low occupancy. The key is how quickly a sponsor can raise yield on cost.
📌 Yield on Cost (YoC) is a key real estate metric that measures a project's stabilized return on total cost, offering insight into value creation. Unlike cap rates, YoC helps assess a sponsor's execution ability and margin of safety. Look for deals with a high delta between stabilized YoC and market cap rates and evaluate past projects based on achieved YoC.
Bottom Line
Say it with me: Never analyze the proforma before vetting the sponsor.
LP investors must conduct thorough due diligence, question overly optimistic assumptions, and verify that projections align with real market conditions. Above all, become an educated investor!
Liked this post? Check out Accredited Investor Insights' 5-part series on How to Read a Real Estate Proforma where we break down each key component in detail.
Written by
Leyla KunimotoLeyla Kunimoto is an LP investor and the co-founder and writer of the Accredited Investor Insights newsletter. She empowers passive investors with in-depth analysis and educational content to navigate private markets with confidence.
Other Articles

What Is a Capital Stack?
Every real estate deal needs funding, which is why real estate syndication and private equity investments have become so widespread. However, where that money comes from and in what order it gets repaid isn't random. It's structured carefully, layer by layer, in what's known as the capital stack.

Power of Community in Passive Investing | Brian Davis
Brian Davis shares how Spark Rental's co-investing club vets deals, evaluates operators, and helps investors build passive income
What is a Capitalization Rate in Real Estate
Learn about cap rates, how they are used in commercial real estate, and how investors should consider them when evaluating passive real estate investments.

Evaluating Real Estate Sponsors: The Role of Social Proof in Investment Decisions
This article explores the role of social proof in evaluating real estate sponsors, the risks of relying solely on past returns, and the dangers of influencer marketing in investment decision-making.

What is a Syndication Real Estate Investment?
A real estate syndication is a common investment structure that pools capital from multiple investors to acquire and manage larger commercial real estate assets.

Using AI, Community, and Transparency to Build a Better Investment Firm with TJ Burns
TJ Burns, founder of Burns Capital and ex-Amazon engineer, joins the Invest Clearly Podcast to break down the real challenges of raising capital and building long-term LP trust.